Join a community of the most creative Business Intelligence Professionals
Join a community of the most creative Business Intelligence Professionals
Find data professionals with skills verified through real challenge performance.
Browse Talent DirectoryCreate realistic synthetic data for training, testing, and demonstrations.
Explore Dataset Generator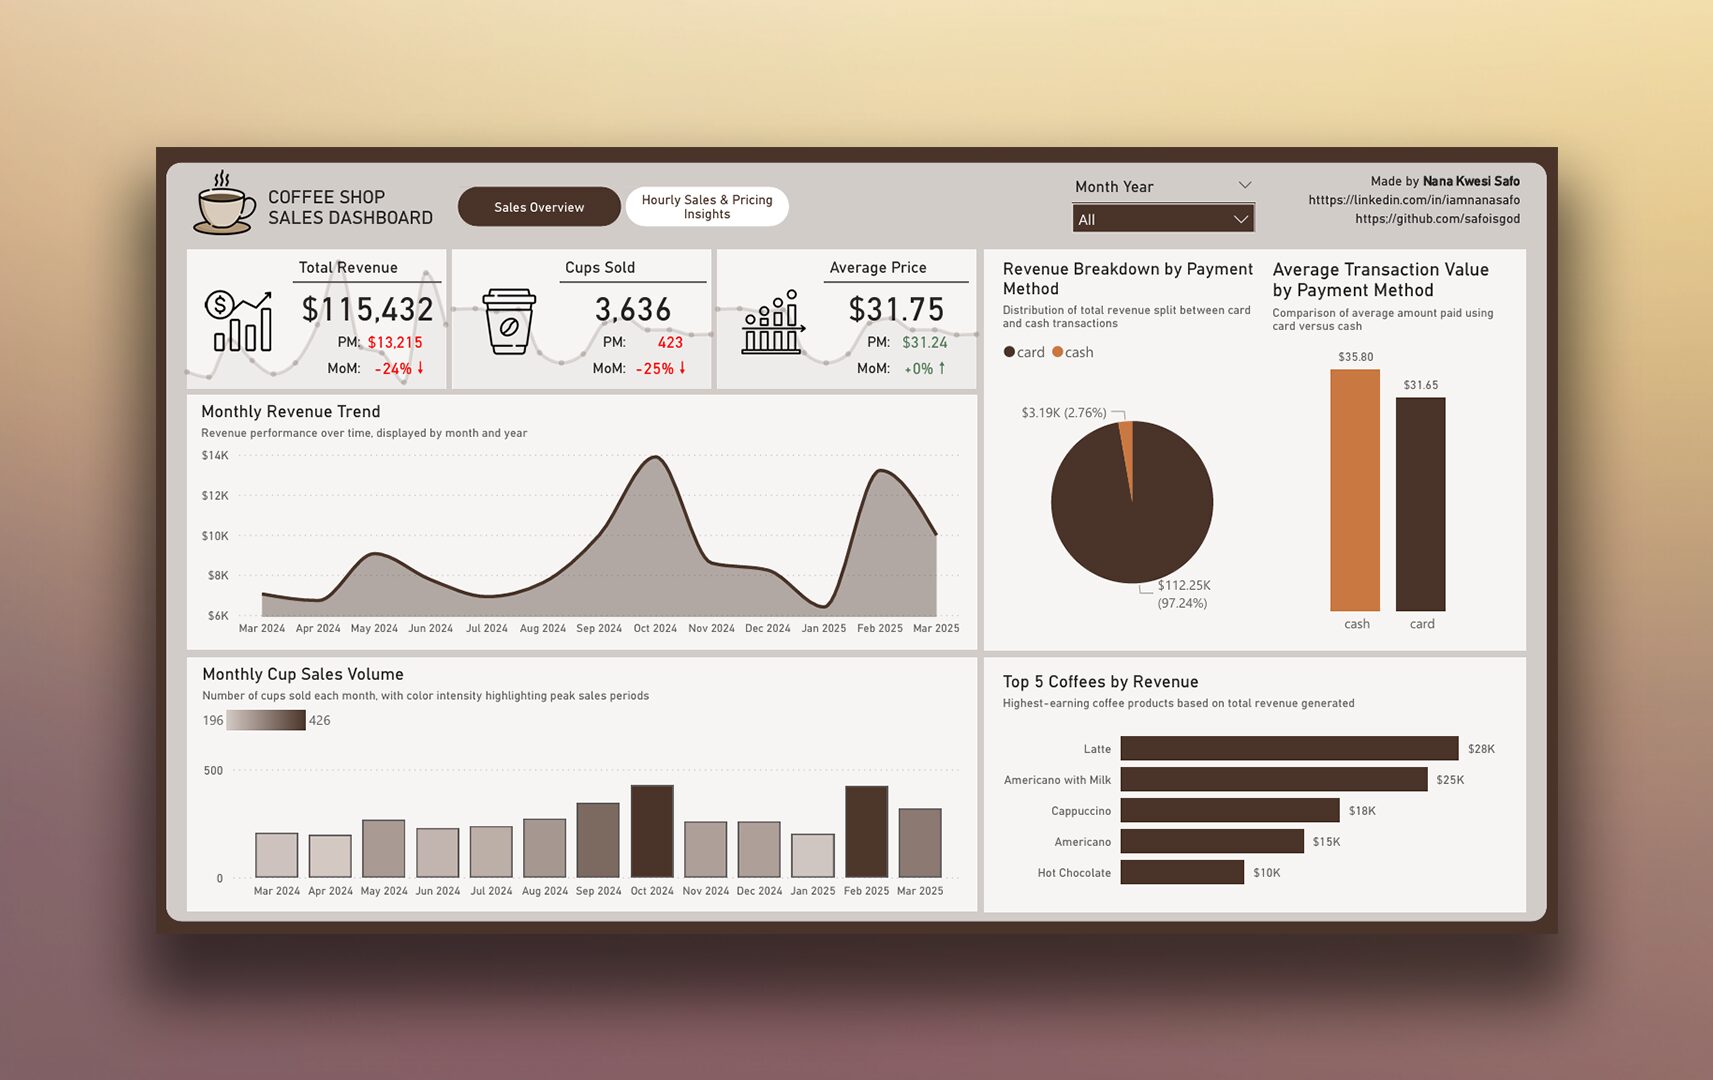
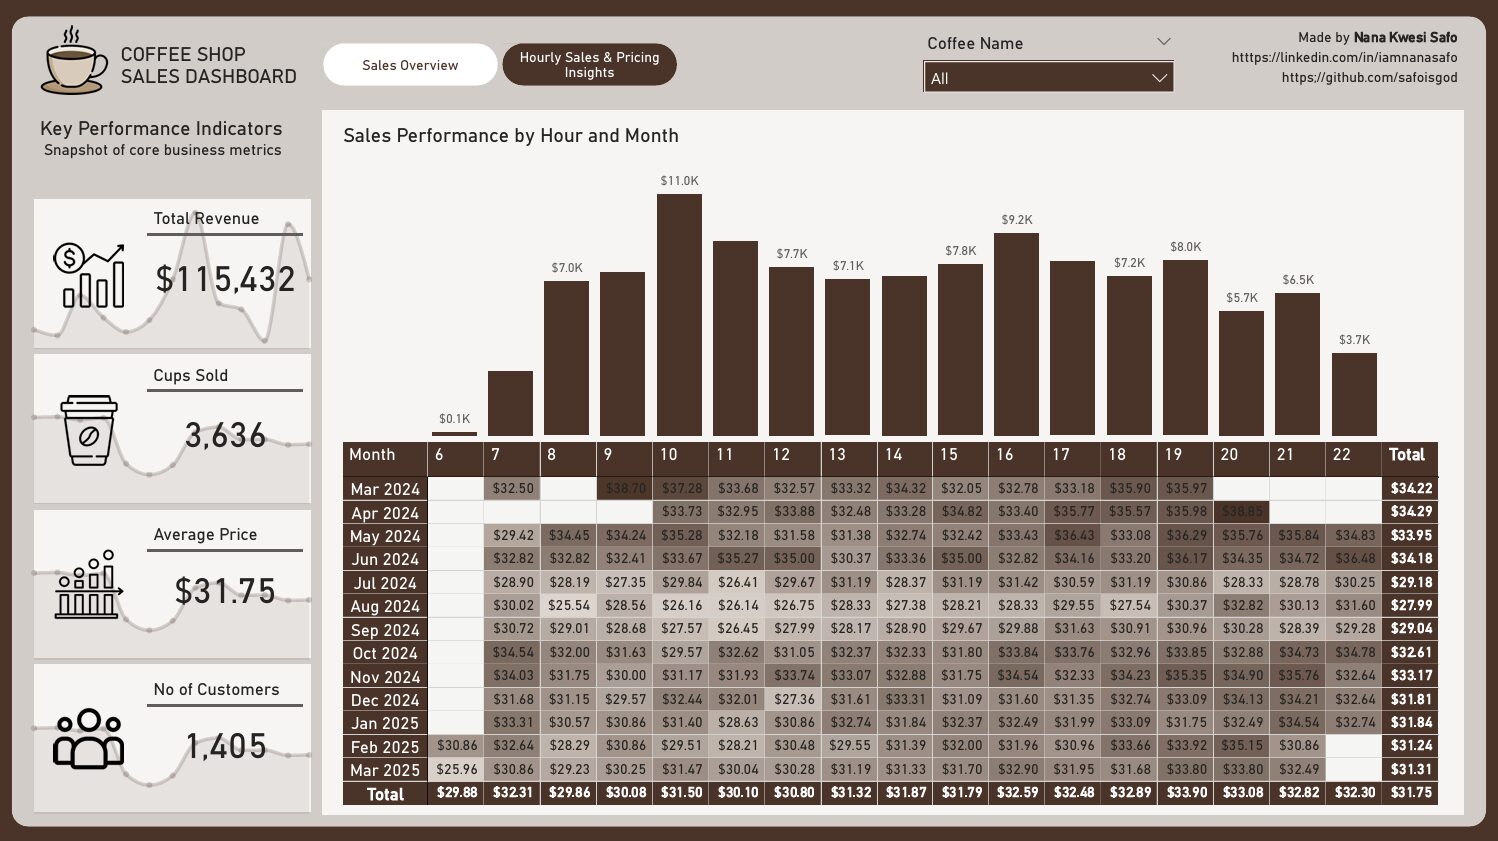
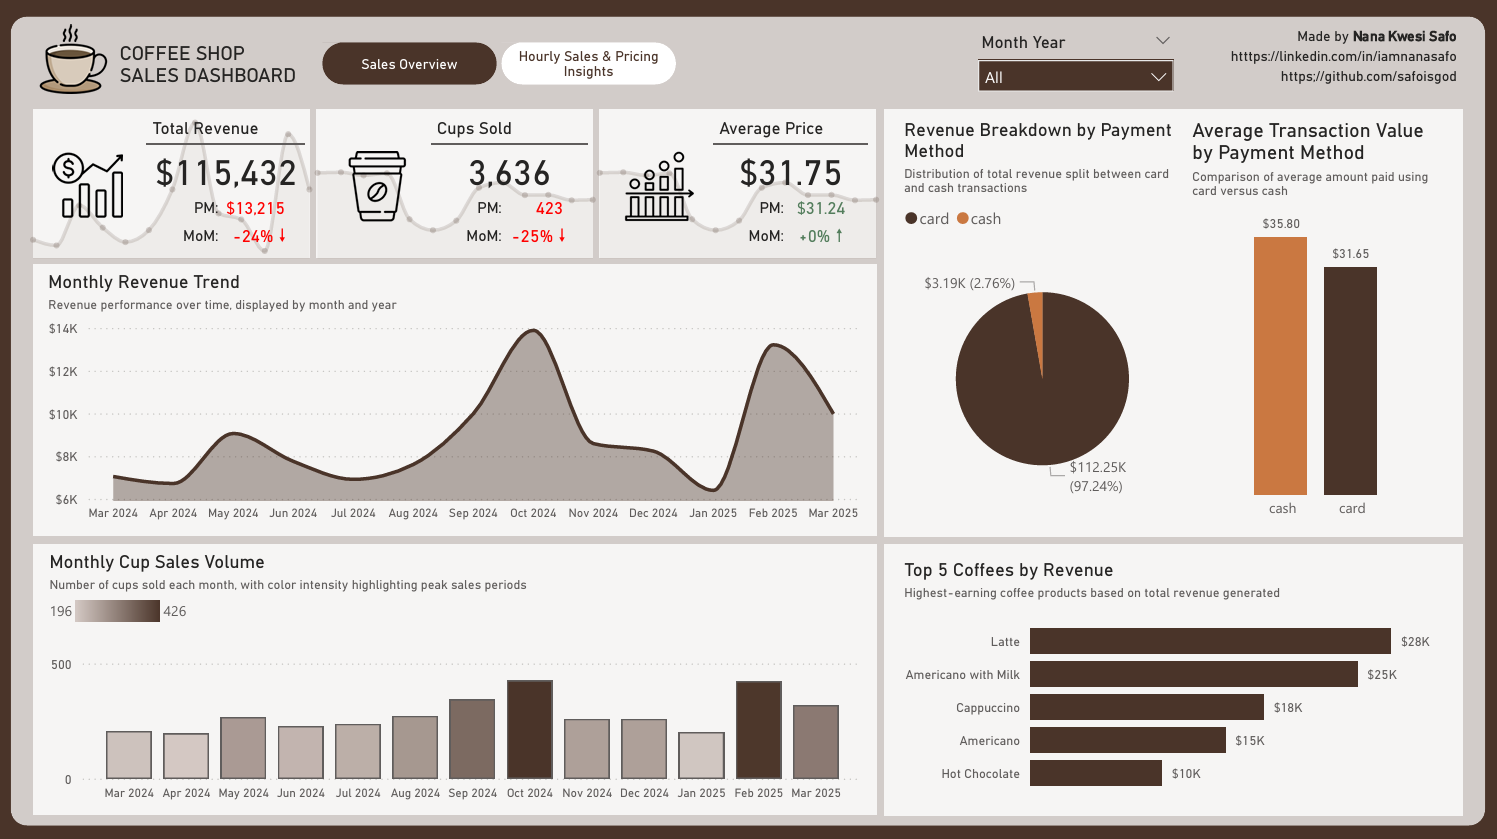
Designed an interactive Power BI dashboard to monitor coffee shop sales performance, achieving $115,432 in total revenue and selling 3,636 cups as of March 2025. Developed by Nana Kwesi Safo, this dashboard features dynamic filters for month and year, providing real-time insights into sales trends and customer behavior. Key Features: Revenue Overview: Displays $115,432 total revenue (-24% MoM, +$13,215 PM), 3,636 cups sold (-25% MoM, +423 PM), and an average price of $31.75 (+0% MoM, +$0.24 PM). Trends: Visualizes monthly revenue and cup sales volume, highlighting peak periods (e.g., July 2024) with color intensity. Payment Analysis: Breaks down revenue by payment method (97% card, 2.76% cash) and compares average transaction values ($35.80 card vs. $31.65 cash). Top Products: Identifies top-earning coffees (Latte $28K, Americano with Milk $25K, Cappuccino $18K). Impact: The dashboard enables stakeholders to optimize pricing, inventory, and payment strategies based on actionable data. Built with Power BI and DAX, it showcases advanced data visualization and analytical skills, reflecting real-world sales dynamics. Technologies: Power BI, DAX
Contact our team

16 Upper Woburn Place, London, Greater London, WC1H 0AF, United Kingdom


 Nana Kwesi Safo
 hiral
hiral 
 Emmanuel
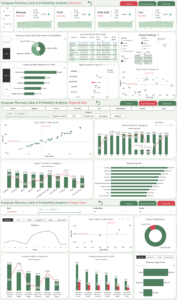
 Mohamed Shaheen
 Tejasvi Suhagiya