Join a community of the most creative Business Intelligence Professionals
Join a community of the most creative Business Intelligence Professionals
Find data professionals with skills verified through real challenge performance.
Browse Talent DirectoryCreate realistic synthetic data for training, testing, and demonstrations.
Explore Dataset Generator
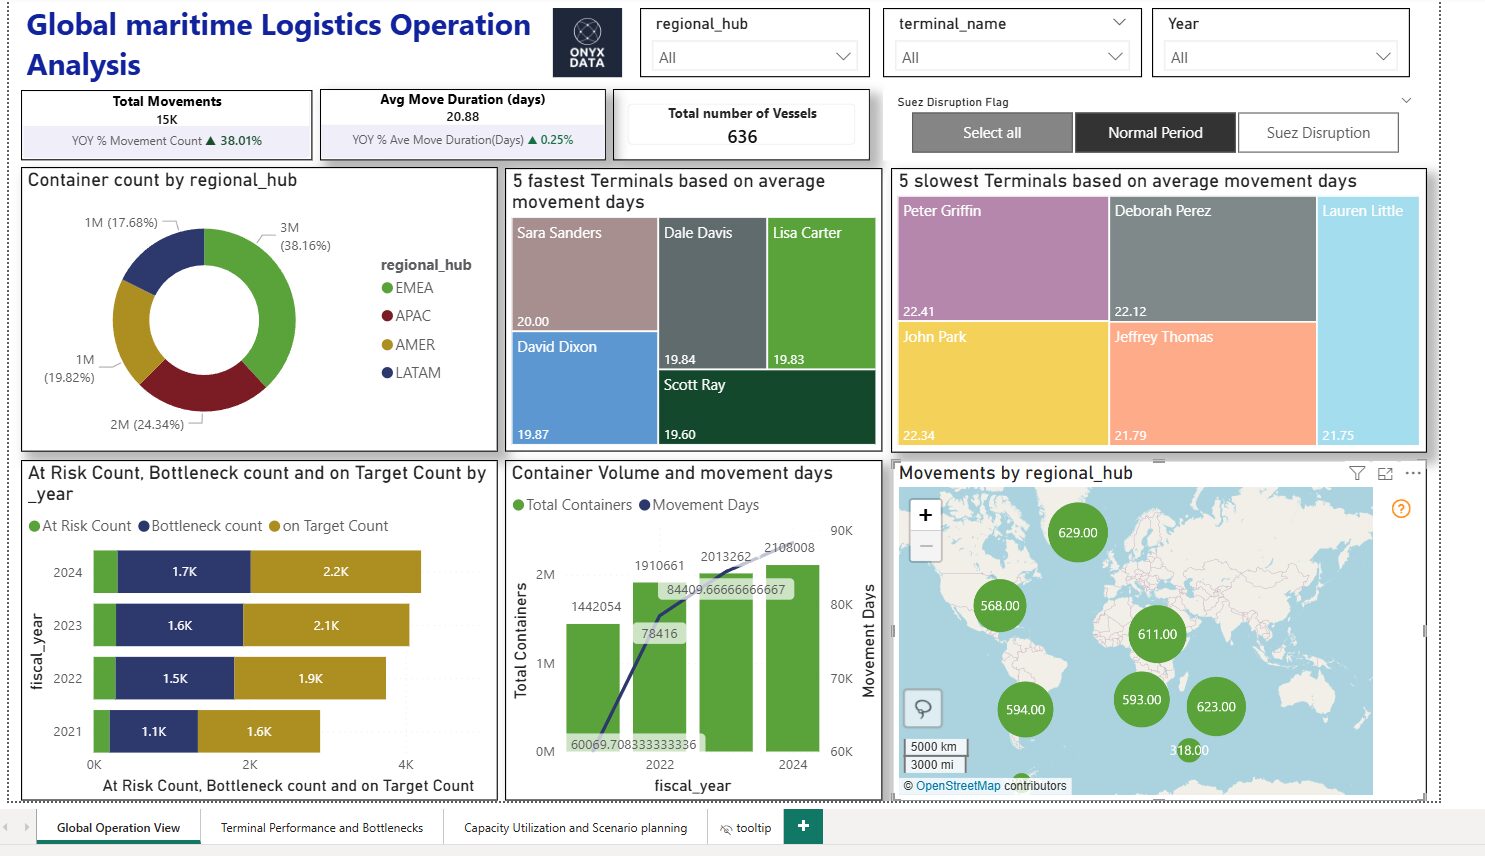
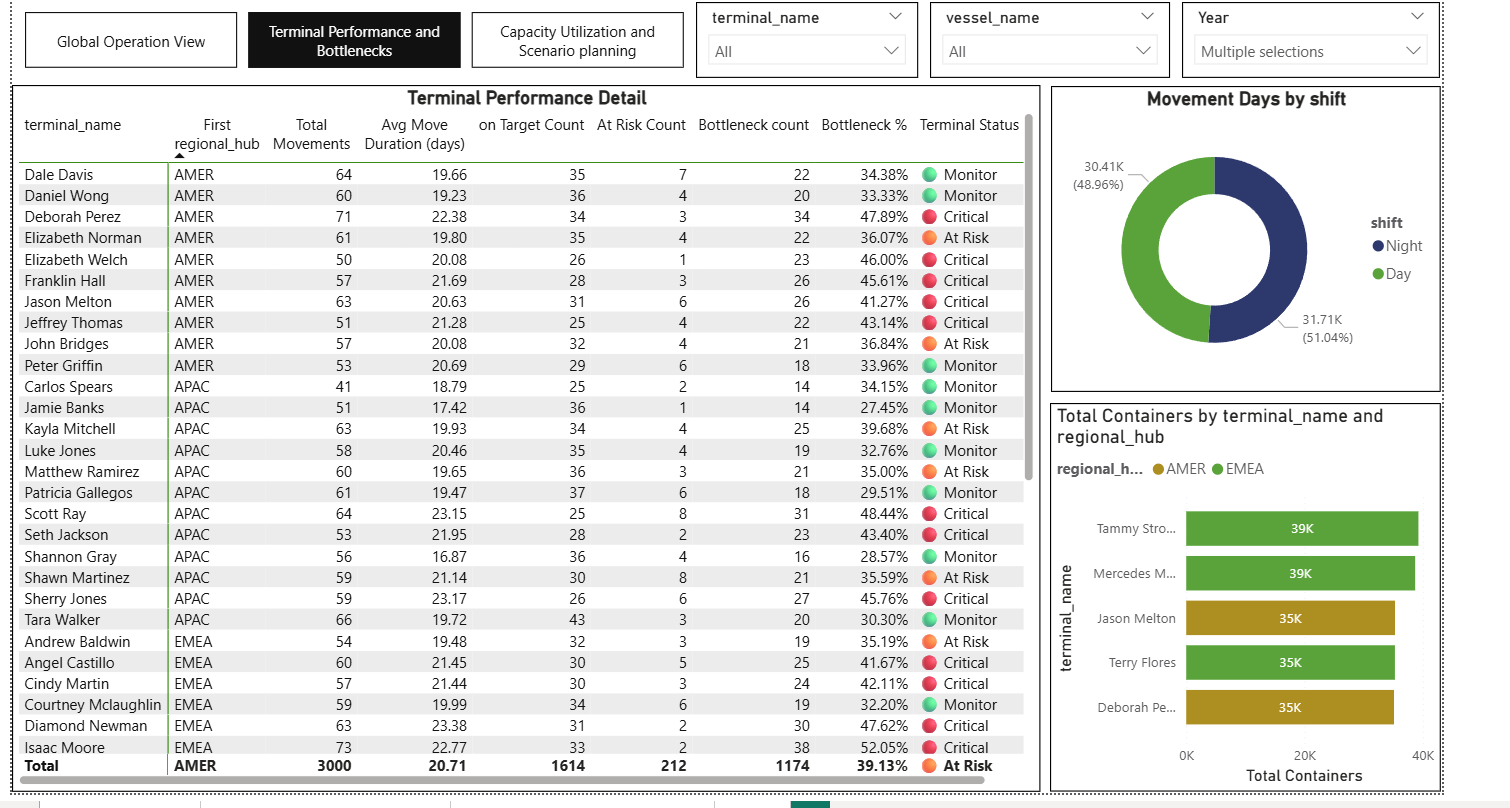
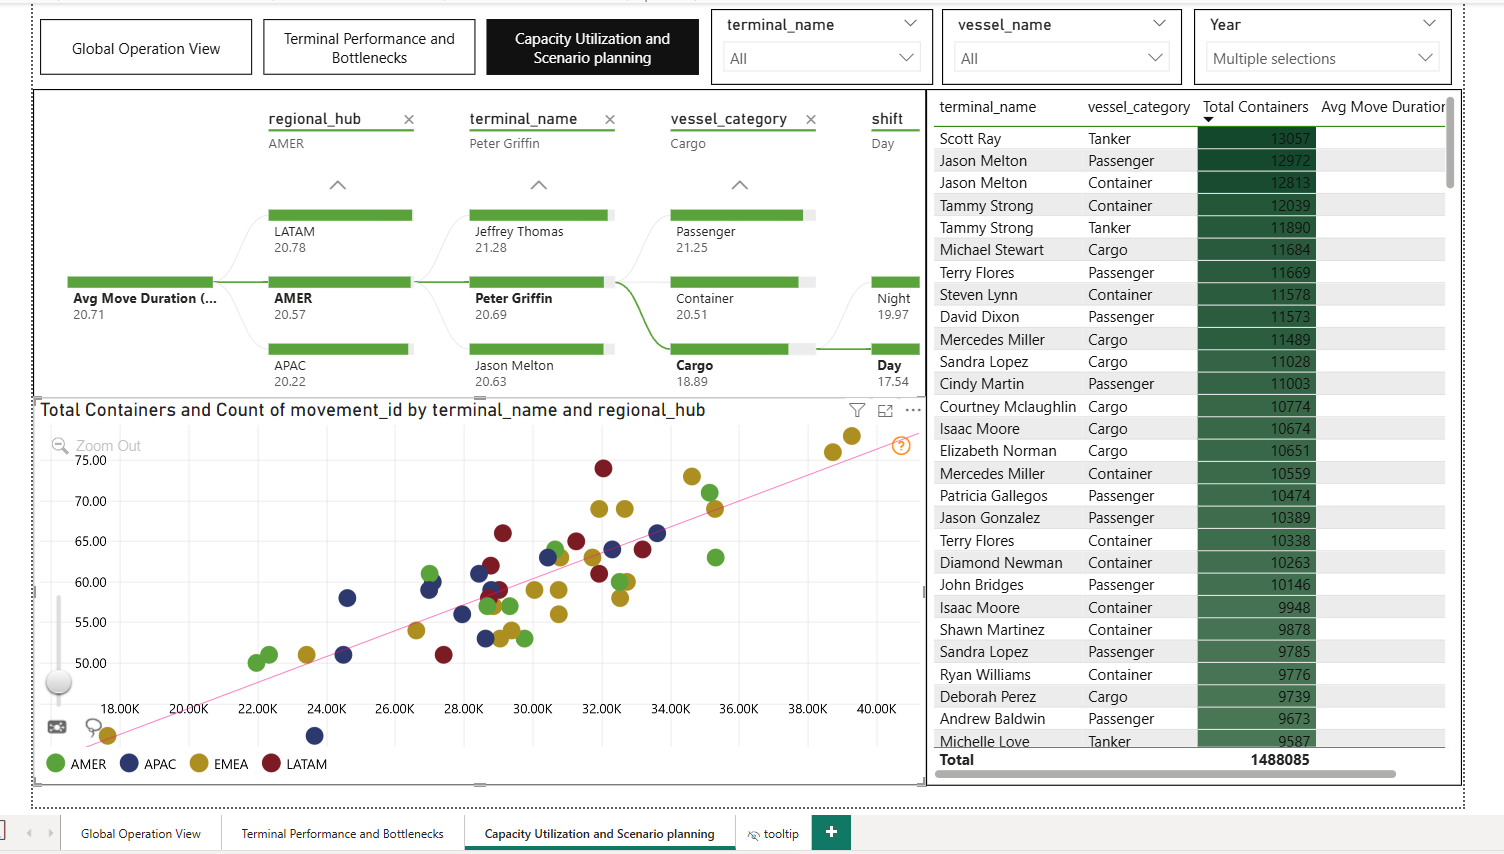
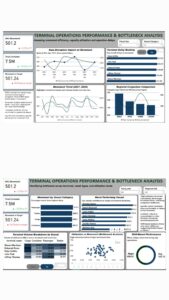
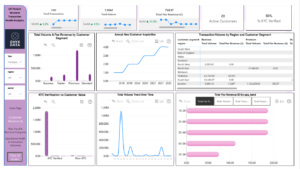
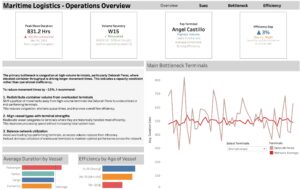
I designed and developed three interactive Power BI dashboards focused on maritime cargo analytics. This project gave me valuable insight into real-world maritime cargo logistics, operational bottlenecks, and how to convert complex data into meaningful visual intelligence. Key Highlights 8M+ total containers analysed 15K+ container movements, including YoY KPI indicators 20+ days average movement time, with YoY comparison Average movement duration by Regional Hubs Top 5 best and worst performing terminals based on movement time Cargo movement behaviour tracked through performance bands: On Target, At Risk, and Bottlenecks A dedicated slicer illustrating the impact of the Suez Canal disruption (23 March–3 April 2021) Analysis of container volumes across the Regional hubs Geographic mapping of regional hub performance based on average movement days Terminal-level breakdown showing operational delays, container throughput, and performance bands Bottleneck percentages highlighted with color-coded severity (e.g., Critical) Movement days analysed by shift patterns (day vs night) A Decomposition Tree to explore factors influencing movement days, including regional hub, terminal, vessel category, shift, and build year Terminal utilization vs movement time examined alongside container volume relationships What I Learned Effective data cleaning and transformation in Power BI Building highly interactive, dynamic dashboards Creating user-friendly visual designs with strong analytical value Enhancing skills in real-world data storytelling
Contact our team

16 Upper Woburn Place, London, Greater London, WC1H 0AF, United Kingdom


 Dmitry Kuvyrdin
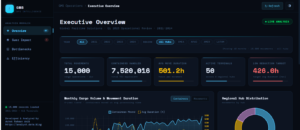
 ashekgo