Join a community of the most creative Business Intelligence Professionals
Join a community of the most creative Business Intelligence Professionals
Find data professionals with skills verified through real challenge performance.
Browse Talent DirectoryCreate realistic synthetic data for training, testing, and demonstrations.
Explore Dataset Generator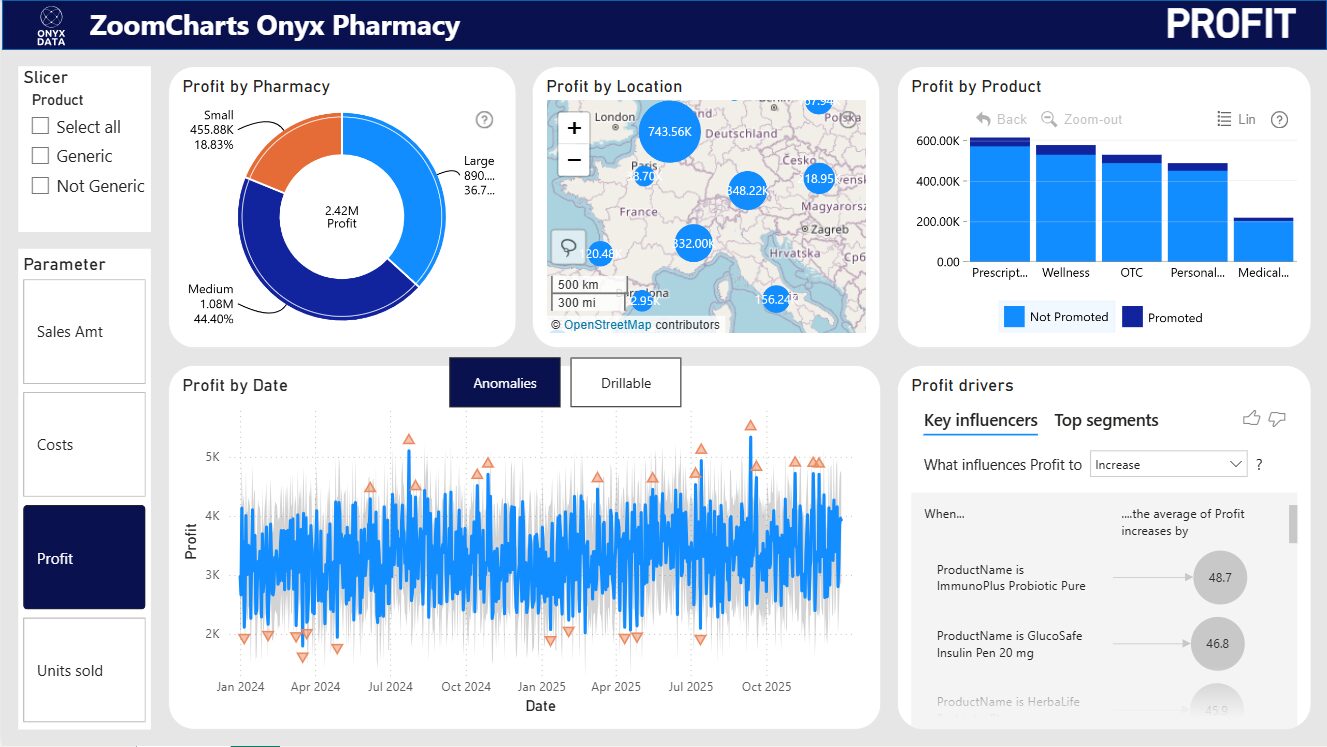
This project focuses on exploring Pharmacy Sales, Costs and Profitability Across Products, Locations, and Time with anomaly detection and Dimensional Profitability Modeling Pharmacy operations generate massive volumes of data, but the real challenge is knowing where to look first and what actually drives profit. This dashboard was developed to act as a strategic compass, transforming raw sales data into a clear, actionable visual story. It explores the operational story behind pharmacy revenue, inventory, costs and profitability across a multi-country European distributor. By integrating high-level KPIs on the Zoomcharts Drilldown donout chart with granular drill-down capabilities, stakeholders can monitor performance in real-time. Interactive visuals make it easy to move from an executive summary to detailed analysis in just a few clicks. Key Insights • Medium-sized pharmacies are the primary revenue drivers, accounting for 44.42% of the total €8.63M sales amount. • "Prescription" products lead the sales hierarchy, with a significant portion of revenue coming from non-promoted items, suggesting strong organic demand. • Sales are concentrated in Central Europe, with major hubs identified in Germany, France, and neighboring regions. • Key Influencers ImmunoPlus Probiotic Pure and GlucoSafe Insulin Pen are the top contributors to increases in average Profit. Rather than answering isolated questions, the report encourages exploration and helps users move fluidly between pharmacies, geography, products, and time to uncover patterns that are not immediately obvious. The result is an interactive, visually guided narrative that supports both strategic oversight and operational decision-making, turning complex pharmacy data into clear, actionable insight. Together, these insights turn raw pharmacy data into a clear narrative: what is happening, where attention is needed, and which actions are most likely to improve profitability. The result is a shift from static reporting to a dynamic, insight-led approach to pharmacy operations management.
Contact our team

16 Upper Woburn Place, London, Greater London, WC1H 0AF, United Kingdom


 Fiza Syed
 Adeel Ahmad Siddiqui
 Abisola
 Clarisse S.