Join a community of the most creative Business Intelligence Professionals
Join a community of the most creative Business Intelligence Professionals
Find data professionals with skills verified through real challenge performance.
Browse Talent DirectoryCreate realistic synthetic data for training, testing, and demonstrations.
Explore Dataset Generator
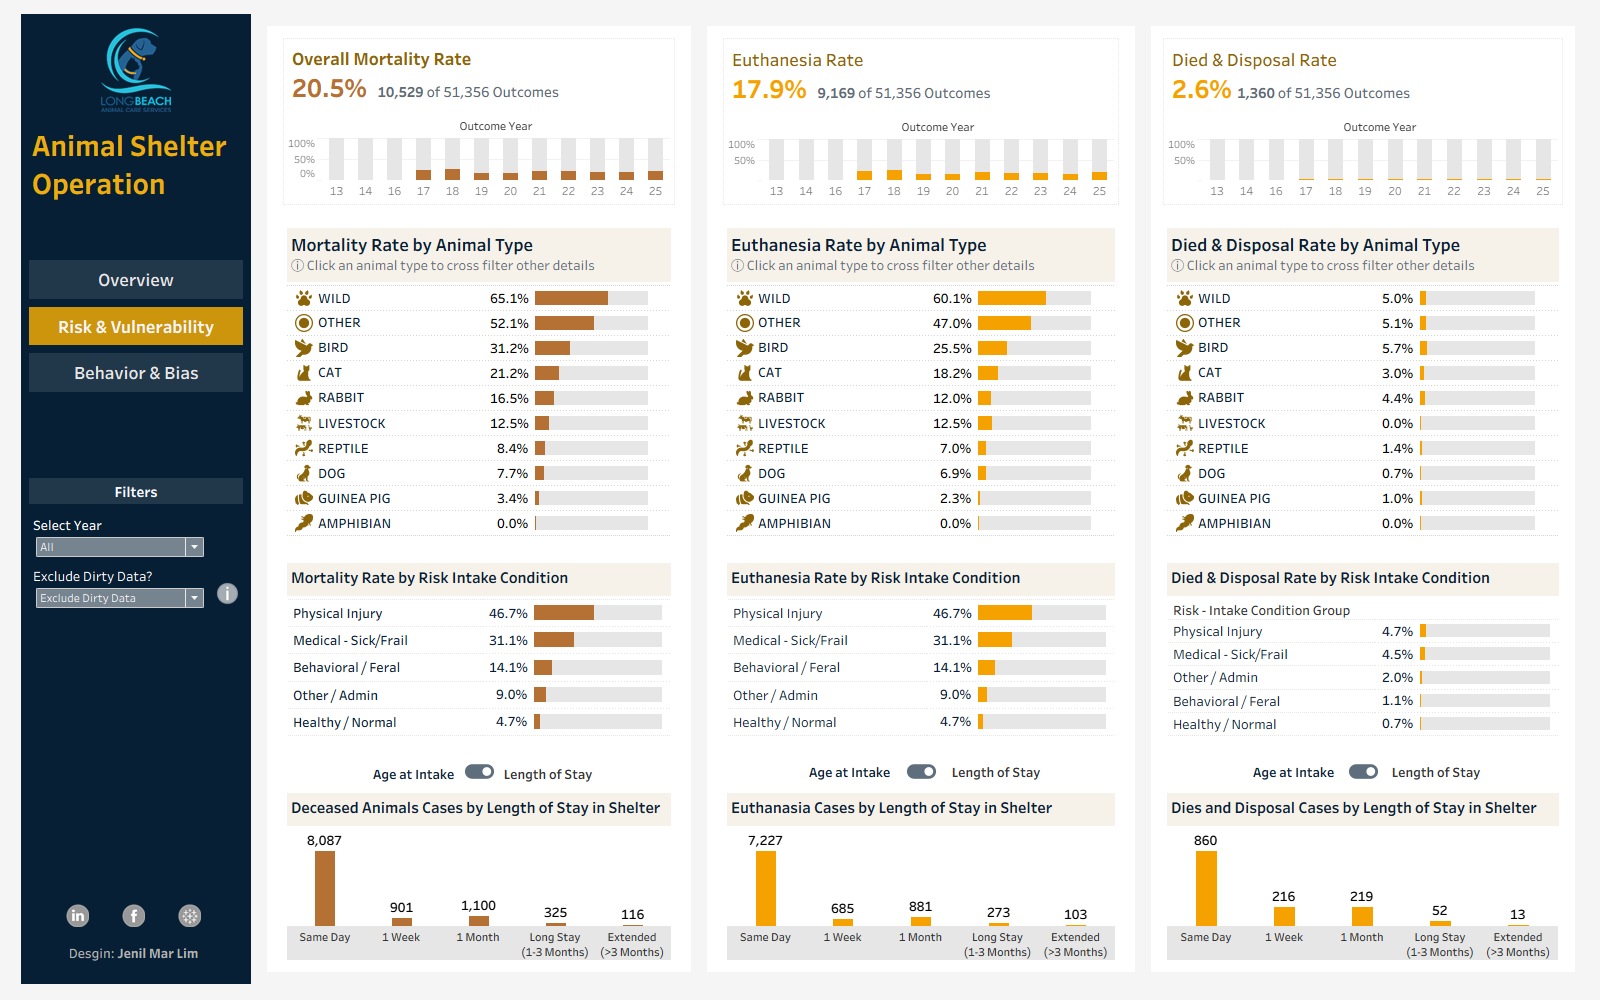
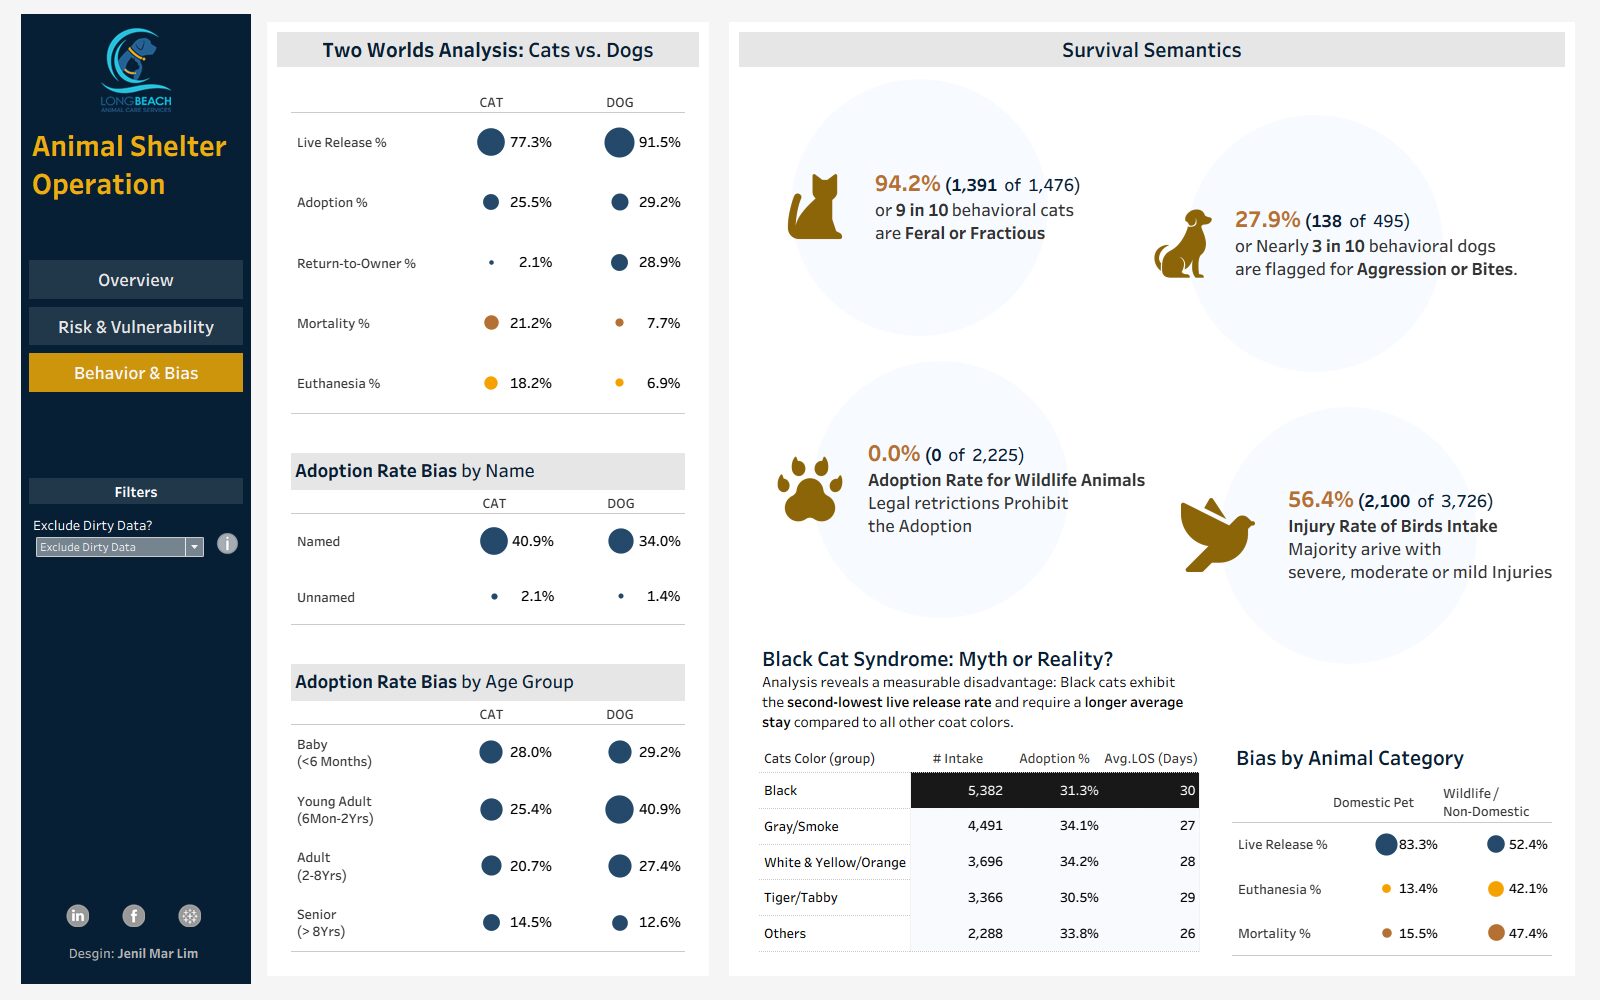
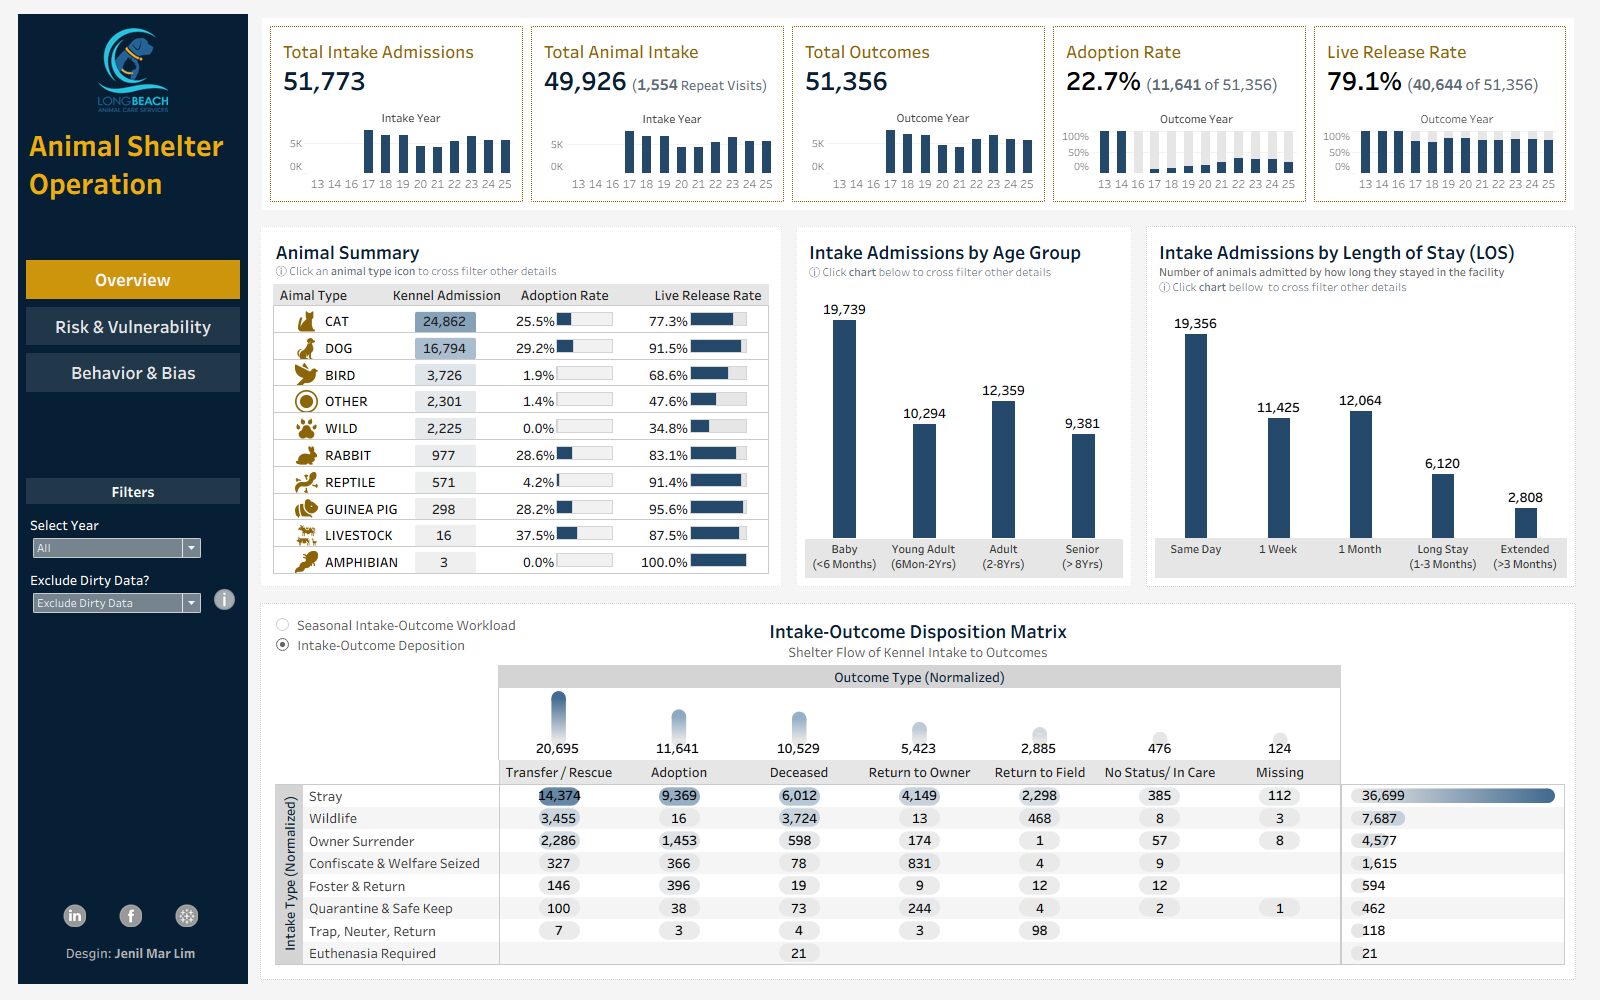
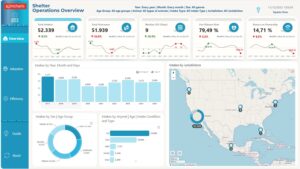
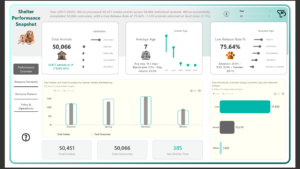
With over 52,000 records, the first step was data integrity. I identified 570 records for exclusion (duplicates and test entries), but rather than simply removing them, I built a Parameter Filter. This allows users to toggle between "Clean Data" and "Raw Data" views to see the impact of data quality on the metrics. I structured this analysis into 3 strategic pillars: 1️⃣ Overview: Featuring dynamic KPI cards that adapt sparklines from Years to Months based on selection. It covers the essentials: Intake matrices, Age Groups, Length of Stay, Adoption Rates and Live Release Rates, and Seasonal workload shifts. 2️⃣ Risk & Vulnerability: A focused look at negative metrics (Mortality, Euthanasia, and Disposal rates). This view identifies high-risk animal groups requiring urgent intervention and specialized care. 3️⃣ Behavior & Bias (The "Psychology" View): Perhaps the most interesting section! I explored the "Black Cat Syndrome" myth, Two World Analysis between Cats and Dogs, Wildlife triage, and Dogs and Cat behavioral labels.
Contact our team

16 Upper Woburn Place, London, Greater London, WC1H 0AF, United Kingdom


 Jenil Mar Lim


 ugo nwasuruba
 Vijay Kumar

 ADEGOKE ADEDOKUN ADERONMU