Join a community of the most creative Business Intelligence Professionals
Join a community of the most creative Business Intelligence Professionals
Find data professionals with skills verified through real challenge performance.
Browse Talent DirectoryCreate realistic synthetic data for training, testing, and demonstrations.
Explore Dataset Generator
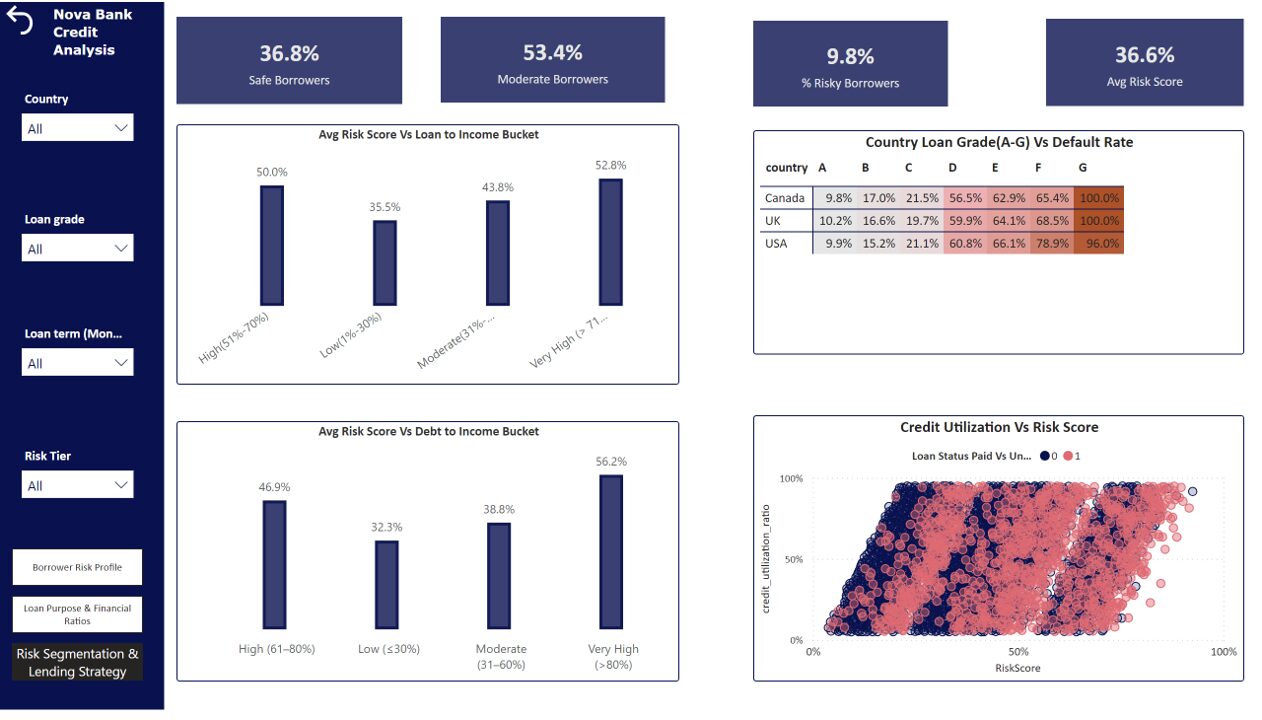
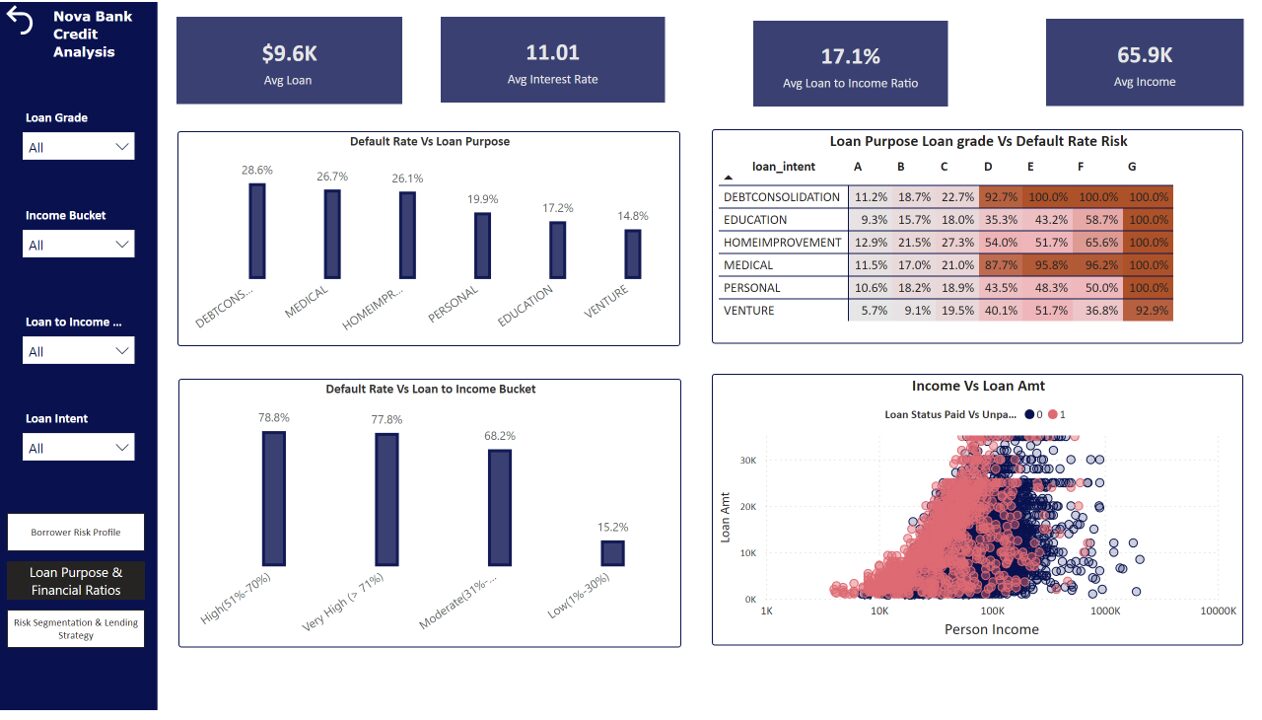
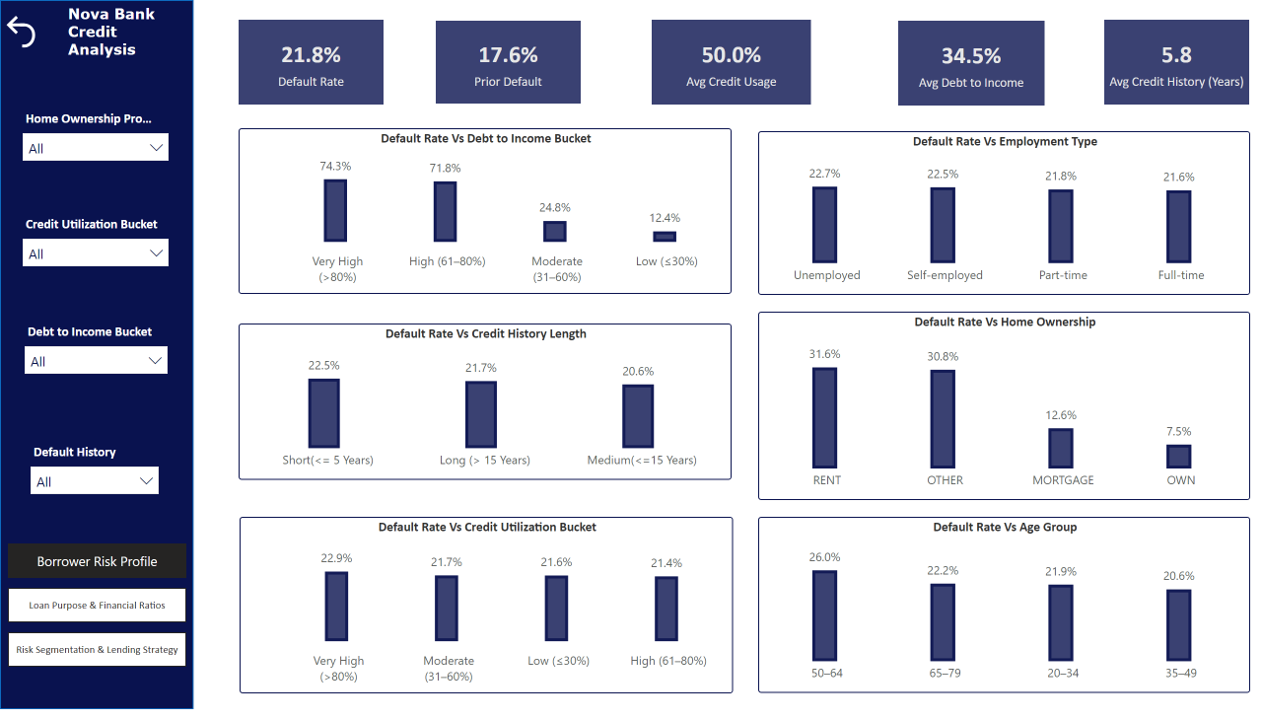
Nova Bank Credit Analysis Project Summary: Borrower Risk Profile This page analyzes borrower risk profile who most likely won’t be able to payback their loan. Default risk using two key financial indicators: Debt-to-Income (DTI) and Credit Utilization. Both metrics are bucketed into four tiers, Low (≤30%), Moderate (31–60%), High (61–80%), and Very High (>80%). It highlights how rising financial debt correlates with increased default rates. The visualizations show clear risk patterns, supporting Nova Bank’s strategy to identify risky borrower profile segments and apply tiered lending decisions. Rental & other have higher default rate>30% compare to home ownership (surprisingly low less than 8%) and mortgage. Age group 50-64 appears risky (default rate 26%) compare to other age group. Loan Purpose & Financial Ratios This page analyzes how loan intent, borrower income, and loan grade impact default risk. It highlights that Debt consolidation & Medical loans, with lower loan grades (D, E, F & G) carry significantly higher default rates >80%. Home improvement loans carry higher default rate. It is interesting that education and venture loans show lower default risk. The heatmap reveals risk escalation across loan purposes and grades, while column charts show that default rates decrease as income and loan-to-income ratios improve. The scatter plot of income vs loan amount adds context on borrower capacity, helping Nova Bank align lending decisions with financial risk indicators. Person income less than 70K have shows loans are mostly unpaid (in red=1) as income increases to 100k and more people are most likely to repay their loans. Risk Segmentation & Lending Strategy This page highlights borrowers into Safe, Moderate, and Risky tiers based on a composite Risk Score calculated using weighted average formula from financial and behavioral indicators. If person has previously default 30%weighted, Debt to income ratio 30%weighted, credit utilization ratio weighted 20%, credit history length (<5 years) 20%weighted. Risk Tier Group category created based on Risk score if risk score is <30% safe, 60 Risky. Visuals show how risk scores rise with higher loan-to-income ratios, lower income levels, and default status. The scatter plot of Credit Utilization vs Risk Score shows that borrowers with lower risk score (35%) are more likely to default. Country-level loan grade analysis indicates that loan grade from D to G higher risk of default. This segmentation of risk helps Nova bank to make better loan decision to whom to approve the loans, who needs more attention and can adjust their lending strategy.

 Akindele Victor Omolayo
1
Akindele Victor Omolayo
1
 Ankur Jain
0
Ankur Jain
0
Contact our team

16 Upper Woburn Place, London, Greater London, WC1H 0AF, United Kingdom


 hiral
hiral