Join a community of the most creative Business Intelligence Professionals
Join a community of the most creative Business Intelligence Professionals
Find data professionals with skills verified through real challenge performance.
Browse Talent DirectoryCreate realistic synthetic data for training, testing, and demonstrations.
Explore Dataset Generator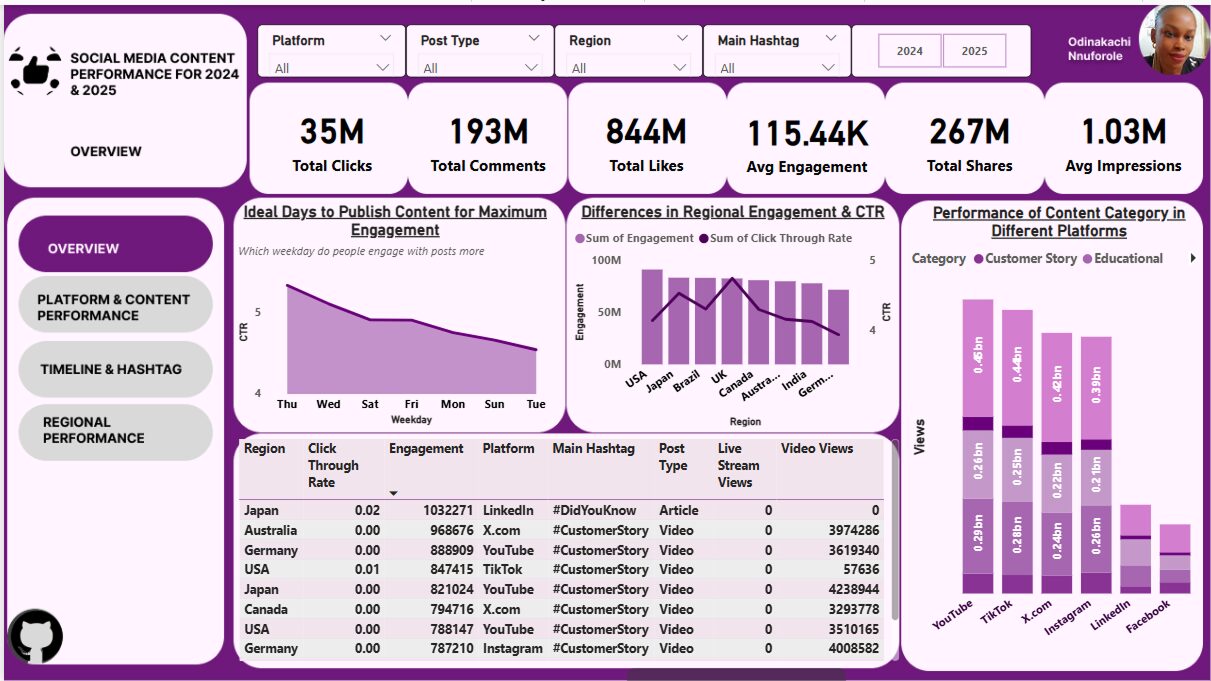
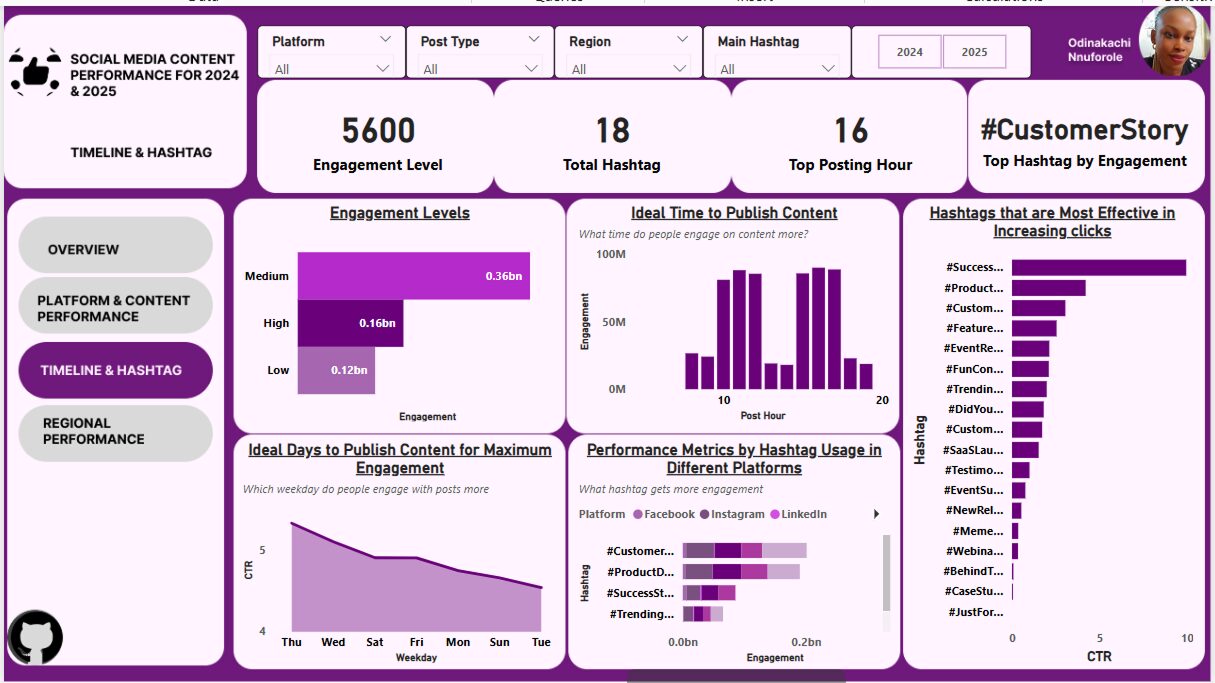
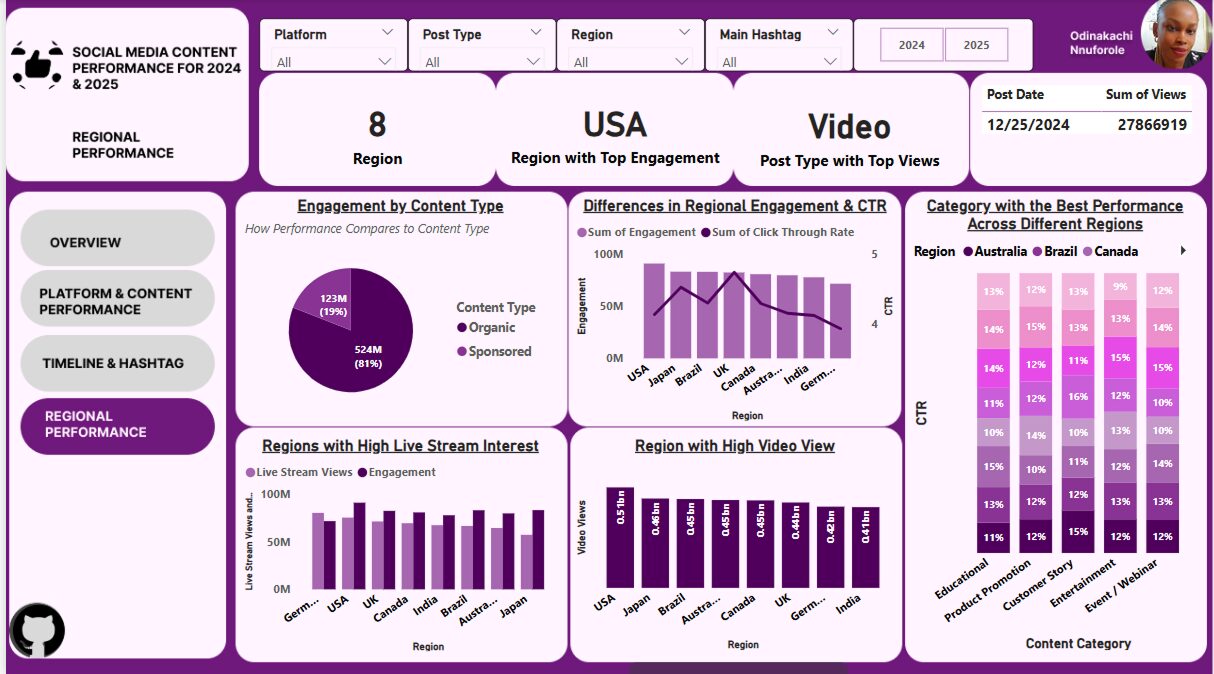
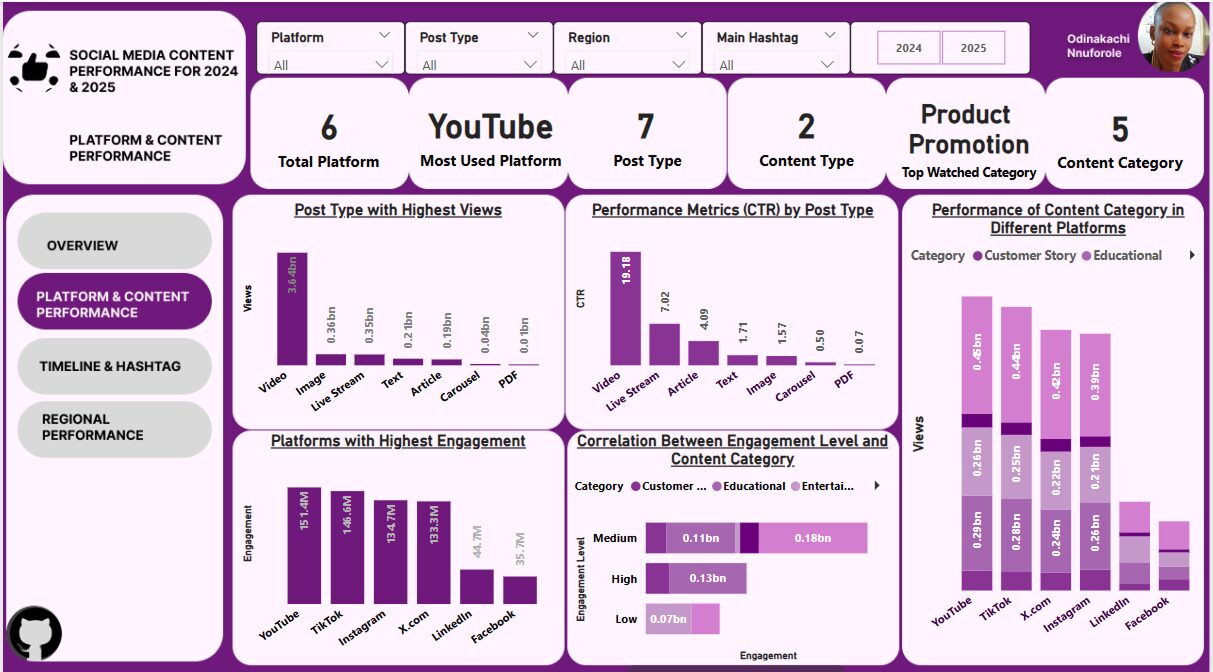
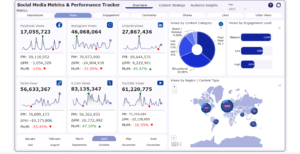
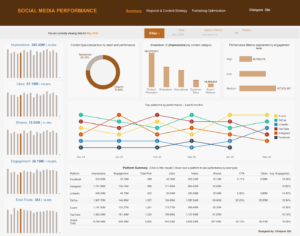
This portfolio showcases my Power BI dashboard for the Social Media Content Performance for 2024 and 2025. It includes interactive visuals that uncover platform-specific content trends, optimal publishing times, regional engagement patterns, and hashtag effectiveness. This deep dive uncovers the strategies driving significant engagement and outlines a clear path for future growth. Key Highlights: Massive Engagement: Achieved 35M Total Clicks, 193M Comments, and 844M Likes, demonstrating strong audience connection. Video Dominance: Video content continues to be our powerhouse, leading significantly in views and Click-Through Rates. Optimal Timing: The data reveals Wednesdays and Thursdays at 4 PM are prime times for maximizing engagement. Top Platforms: YouTube, TikTok, and Instagram are our leading platforms for audience interaction. Global Reach: The USA leads in overall engagement, while the UK shows the highest CTR, indicating diverse regional performance. This analysis provides clear, actionable recommendations to refine our content strategy, optimize posting schedules, and leverage high-performing hashtags like #SuccessStory, #ProductDemo, and #CustomerStory. It shows the need to prioritize video, focusing on top platforms, and tailoring content for key regions to ensure continued success.
Contact our team

16 Upper Woburn Place, London, Greater London, WC1H 0AF, United Kingdom


 Shruti Gupta
 Chinyere Obi
 Vijayanandan Mahalingam